Real performance from CPU busy: an educated guess

In a previous post, I introduced CRIPS – a measurement of the processing power of a CPU (core) based on SPEC CPU Integer Rate.

The higher the CRIPS rating, the better a processor is in terms of performance per physical core. Also, the higher the number, the better the ROI for database infrastructure (in particular, license cost) and the better the single-thread performance.

The method can also be applied in server sizings – if we know how much “SPECInt” (short for “SPEC CPU 2017 Rate Integer Baseline”) a certain workload consumes, we can divide it by the CRIPS rating for a certain processor, and find the minimum number of cores we need to run the workload at least at the same performance.

One problem remains:

How do we measure the amount of SPECIntRate a workload consumes?

The typical OS tools like SAR/SYSStat, NMON, top, etc. do not give us this number, only the percentage CPU busy.

In this blogpost I will present a method to calculate actual performance using standard available OS metrics (CPU busy percentage).

(more…)

Loading

PyPGIO – An I/O generator for PostgreSQL

If you need to generate lots of I/O on an Oracle database, the de-facto I/O generator tool is SLOB (Silly Little Oracle Benchmark).

In the recent years however, PostgreSQL  has gotten a lot of traction and many customers are starting to use it, even for mission-critical workloads.

Last year, one of our customers wanted to run a proof-of-concept for Postgres on all-flash storage platforms to compare different vendors. A major KPI in the POC was the result of running I/O performance tests on Postgres.


So, how do you stresstest the I/O capabilities of a Postgres database?

(more…)

Loading

MEA: Defining Capacity and Performance Metrics

In the previous post, we discussed the current state of many existing Oracle environments. Now we need a method to accurately measure or define the workload characteristics of a given database platform.

In our customer engagements we frequently ask details about databases, for example, “How much CPU power does the database require”, “how large is your production database”, “How much bandwidth is needed”.

As an illustration, let’s say that the answer to the database size question is: 5 Terabytes.

What do we know at this point? We have a rough idea but still a lot of missing pieces of the puzzle.

(more…)

Loading

Maximum Efficiency Architecture: Current State

In the previous post, I announced Maximum Efficiency Architecture – a methodology for achieving optimal cost-efficiency for (Oracle) databases whilst also maintaining (or even improving) business service levels. In this post we will review the current state of typical database landscapes.

From our conversations with many customers as well as looking at their performance data, we come to the following findings and conclusions.

(more…)

Loading

Reducing Oracle TCO: Maximum Efficiency Architecture

IOUG Survey
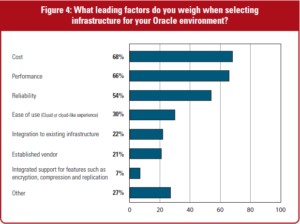
Last year, Dell EMC sponsored the 2020 IOUG Database Priorities Survey. One of the questions was, “What leading factors do you weigh when selecting infrastructure for your Oracle environment?”

The number 1 factor respondents mentioned, was “Cost”. This confirms my own experiences when talking to our customers. High cost is often the main decision factor, followed closely by performance (#2) and a number of other factors, most of which I tend to categorize under the umbrella term “IT Operations”. As you may know from reading some of my other blogposts, I am passionate about achieving maximum efficiency for business applications – which is also the reason for choosing the name of this blog (Dirty Cache) since 2011. (more…)

Loading