Does this story sound familiar?
The end users of a database application start complaining about poor system response and long running batch jobs. The DBA team starts investigating the problem. DBA’s look at their database tools such as Enterprise Manager, Automatic Workload Repository (AWR) reports, etc. They find that storage I/O response times are too high (such as an average of 50 milliseconds or more) and involve the storage team to resolve it.
The storage guys, in turn, look at their tooling – in case of EMC this could be Navisphere Analyzer, Symmetrix Performance Analyzer (SPA) or similar tools. They find completely normal response times – less than 10 milliseconds average.
The users still complain but the storage and database administrators point to each other to resolve the problem. There is no real progress in solving the problem though.
So what could be the issue here?
Performance troubleshooting is a complex task and really there could be all kinds of reasons why this situation happens. But in my experience with customers, sometimes the first step is a real easy one: finding out where the real bottleneck is.
In a lab test I have done a while ago, I collected some performance statistics using the standard Linux tools, here I will show how you can use it to tell the difference between I/O wait on the host (Linux) system versus waits on the storage system.
First of all, the command to show IO statistics on Linux is “iostat”. To get more details on response times, queue depths etc, use
iostat -xk <interval> <disks>
So if you want to get stats for disks /dev/sdb and /dev/sdc with an interval of 2 seconds, use:
iostat -xk 2 /dev/sd[bc]
In this picture with screenshots you can see the output of an Oracle database server running a Swingbench benchmark test:
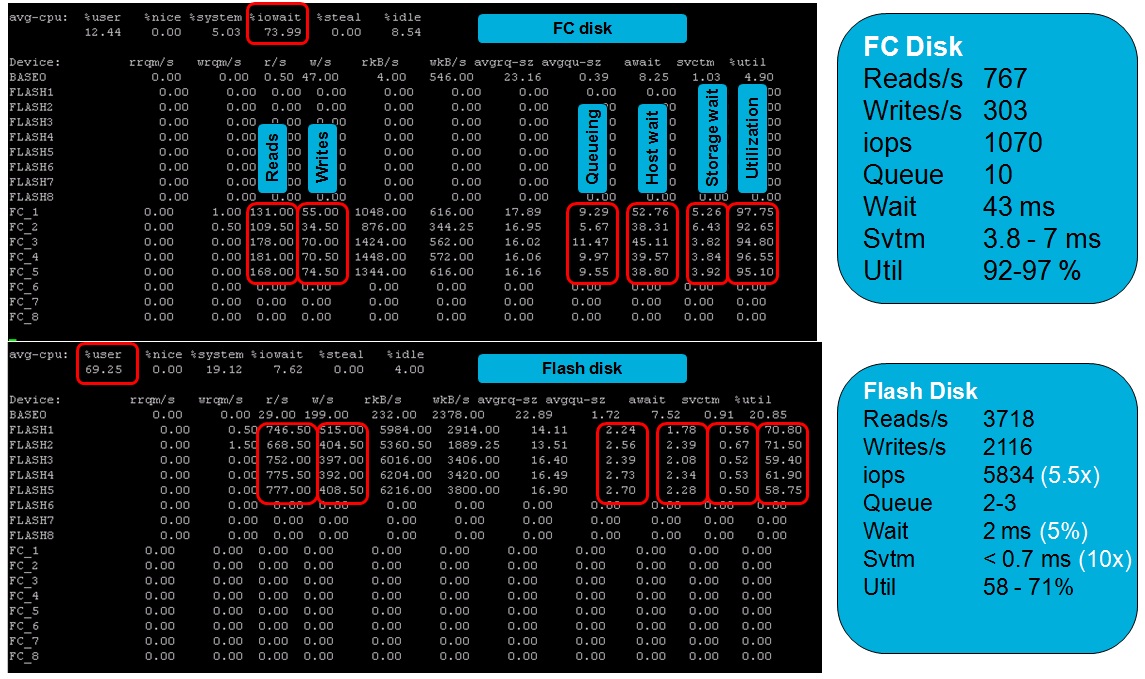
Note that I used a custom script to alter the Linux device names so that they show the Oracle ASM Volume names instead of the Linux device names – to make it more usable for the lab test I was setting up.
If you look at the upper half of the picture you can see activity on the Fibre Channel disks (LUNs) FC_1 through FC_5 (this is what made up the Oracle ASM diskgroup for this database). The system was IO bound (you can see almost 74% IO wait). Now look at the columns “avgqu-sz” (Average queue size), “await” (average wait in the queue) and “svctm” (service time).
In the lower half you can see what happened after moving the database to Enterprise Flash disks, but more on this in a future post π
Service time (storage wait) is the time it takes to actually send the I/O request to the storage and get an answer back – this is the time the storage system (EMC in this case) needs to handle the I/O. It varies between 3.8 and 7 ms on average.
Average Wait (host wait) is the time the I/O’s wait in the host I/O queue.
Average Queue Size is the average amount of I/O’s waiting in the queue.
A very simple example: Assume a storage system handles each I/O in exactly 10 milliseconds and there are always 10 I/O’s in the host queue. Then the Average Wait will be 10 x 10 = 100 milliseconds.
In this specific test you can verify that storage wait * queue size β host wait
A database operating system process will see the Average Wait and not the service time. So Oracle AWR, for example, will report the higher number and storage performance tools will see the lower number. There is a big difference and I’ve experienced miscommunication on this between database, server and storage administrators on several occasions.
Make sure you talk about the same statistics when discussing performance problems!
Reblogged this on Diary of a Confused DBA….. and commented:
This is really interesting. Lots of clue on the subject helping conflict management on hosting application serviceβ¦..
I and reader like me will really appreciate you if you show the script by which device names are relaced by the partition/logical volume name (more generic understanding).
Apart from this here is puzzle..
Until recently I was wondering with a simple question but it seems the answer is pretty complex. The Question is something like…..
An application administrator before implementing the system goes to storage administrator (Lets assume it is real big storage …very big…) to allocate a chunk of TB (space /Lun/ Devices or) for his application to run. Now the application administrator feels doubt that the chunk allocated to him does not satisfy the IOPS hunger of the application. So he returns back to storage administrator and ask …Tell me what maximum IOPS possible in the storage chunks you allocated to me……The Storage administrator remain speech less…..How can he calculate the IOPS maximum possible to the storage chunks which is spread over multiple disk drives, some partially and some fully……..
Can you throw some light on it?
Hi Soumen, good to hear from you again!
First the easy one… you asked for the script that translates linux devices into ASM volume names…
This is a quick-and-dirty small script that depends on ASMLib and sg3-utils being installed (it needs the command “sginfo”.
Here is the script:
——
#!/bin/bash
if (( $(id -u) != 0 )); then
echo “Please run as root”
exit 1
fi
cd /dev
sedstring=$(sginfo -l |awk -F’ ‘ ‘$0 ~ “scsi” {print $2″ “$3” “$5}’ | sed “s/scsi//” | sed “s/id=//” | sed “s/\[=//” | sort -n -k 2,3 |\
while read dev scsi lun
do
if [ -b ${dev}1 ]; then
maj=$(ls -l ${dev}1 | tr ‘,’ ‘ ‘ | awk ‘{print $5}’)
min=$(ls -l ${dev}1 | tr ‘,’ ‘ ‘ | awk ‘{print $6}’)
vol=$(ls -l /dev/oracleasm/disks | tr ‘,’ ‘ ‘ | awk -v maj=$maj -v min=$min ‘$5 == maj && $6 == min {print $10}’)
[[ “$vol” != “” ]] && printf “s/${dev##*/}1/$vol/;”
fi
done )
iostat -xk sd[c-z]1 2 | sed $sedstring
——
Now the other question. The app administrator wants to know how much iops a certain LUN can provide. There is no straightforward answer to that question, many things influence the iops capabilities of the LUN.
To name a few:
– read/write ratio
– how much (true) random io vs. random-ish io vs sequential (and this relates to the real physical disk level, not just what the application is doing – some volume managers, file systems and storage architectures mess up sequential IO and convert it into random – ouch!)
– blocksize / io size
– skewing
– Disk type (SATA, FC, SAS, SSD/EFD) and disk characteristics
– IOPS density (how many iops are served per gigabyte)
– how many physical disks make up the LUN (i.e. the RAID, striping, metavolume, and virtual provisioning configuration)
– How busy are all resources involved with that LUN with doing other stuff (i.e. serving other LUNs or even other applications – resulting in queueing and higher % busy of resources)
– How well does storage caching and pre-fetching work (i.e. do all I/O’s need to come from physical disk or can we provide the majority somehow from cache)
I plan to write some blog posts more on these topics. But for now your question is still unanswered… π
And I get that question from many of my customers, too. So what to answer? I can only give an answer based on assumptions and without guarantees. But here is my direction:
– Don’t provide the iops for a single LUN but for a set of LUNs that serve the database
– Assume no other IO load is using any shared components or other LUNs
– Figure out how much disks of what type make up the LUN
– Assume an IO workload type (i.e. r/w ratio, block size, skewing, etc)
– Calculate how much random IOPS the disk backend can serve (included overhead for RAID etc)
– Assume the expected storage cache hit ratio (i.e. for Oracle on EMC you will find this probably higher than expected π
– Calculate the max iops for that workload
Quick (incomplete) example:
FC disks, 10K rpm, can do 120 random iops (but size for 85 to avoid high latency)
So 20 disks can do 2400 random iops but calculate with 1700
In RAID-5 3+1 random writes cause 2 disk writes (sometimes 4, sometimes 1.33)
So if the workload is 80/20 read/write, then there is some RAID penalty.
Assume for reads you will have 70% storage cache hit. Writes all go through cache, and have to be written to disk later (few exceptions) but redo writes (about half the write IO of a database) are sequential.
So 1000 db iops will cause 800 reads and 200 writes, of those 800, 560 will be cached and of the writes, 100 are sequential and hardly generating random seeks. So the effective IO load of 1000 db iops is 240 (r) + 100 (w)
This equals out to 240 random reads on disk and 200 random writes (because of RAID penalty). Total 440. So the host IO/disk IO ratio is 1000/440 = 2.3 (rounded)
Meaning the 20 FC disks can do 1700 * 2.3 = about 3900 iops.
Note that I am cutting some corners here and depending on the type of app your mileage may vary. A datawarehouse with huge full table scans will generate large sequential IO’s so you will see less than 3900 (but at a high throughput). An order entry system where most of the transactions are in the recently created table rows (therefore good cacheing in storage) will probably do more than 3900. And so on. Also DB settings can cause differences. Consider redo log duplexing for example, or archivelog mode on or off. Or changing block sizes.
But you have to start somewhere.
Hope this helps…
Well there is only one detail maybe you missed. Let’s assume you would like to weight yourself. You never would try to relay on a guess you made while stepping on your own hands to weight yourself. right ? but this is what happen here. You take the iostat values for an absolute statement about io performance. I would not agree to do so. Cause the way io steps through the OS can lead to latency and you might see “bad” values on iostat – but it is related to the hardware-configuration of you server, multi-path software, block-sizes on logical volumes, file systems or application…..
So as soon we talk about FC I would recommend to have a look also to the FC switches. Particular average frame size, buffer-2-buffer count zero, discarded due to timeout counters. Other then that you should have a look to the scsi protocol on the HBA’s. What’s about scsi queue depth ?
So this isn’t that simple – but it isn’t that complicate. You have to take a look to the complete system and not one some values on the OS π And please keep in mind: all io on a FC attached storage goes to a LUN which resides in RAM π discussing raid stripe size and so on is a talk from yesterday…..as long as we talk about Storage Systems like EMC VMax or HDS VSP – they use pools, dynamic data shifting between different physical storage like flash, fc-disks, SAS. In most cases it is not a topic of a storage system itself. But that’s not the point. the point is: take a look to the complete system/all components and gather facts from different places. be sure what these value may really state and if they really explain the cause of a problem or a behavior. Be sure that a measurement is not affected from workload !
So the best way to measure io is to do it outside of the server and outside of the storage ! (get scsi command to first data and command completion times on read/write commands, scsi sense code and management traffic, FC buffer credit management and frame size)
Hi Martin,
I think you would be interested in another post I wrote later than this one:
http://dirty-cache.com/2011/11/07/performance-io-stack/
Back on your comments, few thoughts. First the philosophical stuff. I COULD weigh myself stepping on my own hands, as long as my entire body is on the scale.
But I think you mean to another law of nature, the Observer Effect (http://en.wikipedia.org/wiki/Observer_effect_%28physics%29) i.e. you cannot measure a phenomenon without influencing it – so, measuring performance influences the performance itself π
Whether this effect has a huge influence on this level is food for another post maybe. Many statistics are collected (measured) anyway so taking a look at already measured stats doesn’t pose a problem.
You are right that IOstat metrics are potentially inaccurate. My response to that would be:
a) you have to start somewhere,
b) what IOstat “sees” is (in my experience) similar to what the database “sees” (wait time) but adds a valuable metric that the DB doesn’t see (service time).
What the “cause” is of the reported service times can be found through methods and components such as the ones you mention – if you need to dig deeper.
c) EVERY performance measurement tool is somewhat inaccurate. So if you look for the perfect tool before you start fixing problems, you will never get it done.
Thanks for your insights!
Good Morning ! Hello Bart ! π
Thank you. Yes you are right about the “Observer Effekt”. And I would like to see how you do weight yourself by steping on your hands π I will habe a look to you other articles too.
and by the way: You do a good job with the Site “Dirty Cache” !
Martin
I was thinking like this (weighing while standing on your hands):
http://dirty-cache.com/2016/01/weigh-on-hands.png
(just kidding π
Thanks for the comment!
Hello Bart,
hehehe…yeah that’s funny. Maybe I should write “step on you own hands” next time π
Meantime I was writing a replay but I am not sure if this helps other users…cause it’s going over your idea to give a first help how to use iostat as en entree point So I will keep this in your hand and you can read and burn it afterwards. I am pretty sure that your message about iostat is the right one and every important things are already written. So thank your for this good site about storage infrastructure. I will keep reading it !
Well you are right. But to be still on the philosophical path: would not the pain have a bad influence about your opinion about the “performance” values at all ? π
But in one point I would no full agree: c) EVERY performance measurement tool is somewhat inaccurate.
If you measure on the wire (using a Fiber Coupler Product) with an XGig Fire Channel analyzer then I would assume to have very, very accurate values. Also using other products where FC protocol gets decoded and metrics used liked scsi command to first data and command completion times.
Well to start somewhere: If you see kind of “strange io stat values” and you deal with a fibre channel environment, a good starting point is to have a quick view to the important FC metrics I mentioned (Bufer count zero and discarded due to timeout). This can be done in nearly no time π
You right on point b – but this hits the “Observer Effect ” like iostat will do. FC is a very simple protocol – specialized for doing io transfer. If you not run FCoE you should have an easy life with it.
I like your graph on you post https://dirty-cache.com/2011/11/07/performance-io-stack/ very much ! There we can see how many components meanwhile involved especially running on a virtualized system. On more argument that we can not easy analyze a problem cause a software-tool inside this stack can easy be influenced by one of this component and we will step on the wrong path.
I work on storage infrastructures now over 10 year and did a lot of troubleshooting including fc analyzer. Most of the problems are based on a bad design but over all on top: bad knowledge of the administrator (and not only server administrators…) One of a lot of examples: I saw often that VMWare Servers build with wrong populated HBA and 10GBit ethernet cards. Means they choose the wrong PCi Slot for the HBA’s on a Dell R920 and other Dell Servers in that case. PCi Slots are related direct to one CPU. If you blindly populate the PCi Slot of a server you will run into problems. Later you can see while discarded due to timeout happen or a high amount of buffer2buffer credit zero count on Fibre Channel Ports of this server (so called “slow draining device”). But people dont pay attention on such easy to handle things. I saw this bad design also on AIX servers. Another topic is wrong zoning. I saw endless discussion about “We will zone all storage ports to the HBA port cause of (bla bla bla)”.But well….there are a lot of good articles about such things.
Best Regards,
Martin
iostat’s service time is useless. You can calculate yourself if you want using v$asm… views to get device stats but you will get misleading values.
For Oracle, what you ALWAYS want to check is DBA_HIST_EVENT_HISTOGRAM if you have AWR or v$EVENT_HISTOGRAM captured with some constant time period as it contains counters only. On OS level you can get the same data using systap or dtrace.
Thanks Bart for clarifying very minute details, this post will definitly give both DBA and Storage admin to drill-down to the exact problem rather going round and round with no resolution.
After i read your post, i quickly ran iostat -xk on 2-node RAC and device ’emcpowerg’ shows high %util when compared to other devices.
Why is this device used heavily, is something we can do from our end to distribute the work evenly on all the devices.
node 1:-
{
avg-cpu: %user %nice %system %iowait %steal %idle
17.75 0.00 4.19 7.00 0.00 71.06
Device: rrqm/s wrqm/s r/s w/s rkB/s wkB/s avgrq-sz avgqu-sz await svctm %util
emcpowera 0.00 0.00 269.20 21.40 2171.20 188.80 16.24 0.32 1.09 1.08 31.26
emcpowerb 0.00 0.00 163.80 20.40 1310.40 164.80 16.02 0.19 1.04 1.03 18.92
emcpowerg 0.00 0.00 2140.60 541.00 63670.40 73782.40 102.52 1.82 0.68 0.35 94.38
emcpowerf 0.00 0.00 0.00 1091.40 0.00 2165.00 3.97 0.26 0.24 0.24 25.92
emcpowerc 0.00 0.00 0.00 186.80 0.00 360.00 3.85 0.04 0.24 0.24 4.46
emcpowerd 0.00 0.00 0.00 0.00 0.00 0.00 0.00 0.00 0.00 0.00 0.00
emcpowere 0.00 0.00 1.80 0.80 0.90 0.40 1.00 0.00 0.08 0.08 0.02
}
node 2:-
{
avg-cpu: %user %nice %system %iowait %steal %idle
4.48 0.00 1.58 5.21 0.00 88.73
Device: rrqm/s wrqm/s r/s w/s rkB/s wkB/s avgrq-sz avgqu-sz await svctm %util
emcpowera 0.00 0.00 2.00 1.00 32.00 9.60 27.73 0.00 0.20 0.07 0.02
emcpowerb 0.00 0.00 79.60 1.60 10176.00 12.80 250.96 0.10 1.23 1.23 9.96
emcpowerg 0.00 0.00 495.60 1.20 58142.40 67.20 234.34 0.77 1.55 1.51 74.90
emcpowerf 0.00 0.00 0.00 2.40 0.00 52.20 43.50 0.00 0.25 0.17 0.04
emcpowerc 0.00 0.00 0.00 7.00 0.00 21.30 6.09 0.00 0.31 0.31 0.22
emcpowerd 0.00 0.00 0.00 0.00 0.00 0.00 0.00 0.00 0.00 0.00 0.00
emcpowere 0.00 0.00 2.00 1.00 1.00 0.50 1.00 0.00 0.00 0.00 0.00
}
Regards
Raheel Syed
http://raheeldba.wordpress.com
Hi Raheel,
Thanks for the feedback! Currently I am at the EMC World conference so pretty busy here attending sessions and meeting many colleagues and customers, but let me get back to you somewhere next week.
Finally some time to look at the details you posted…
First I’d like to point out that if you have SAN storage (from EMC but I guess the same is true for others) then you cannot completely rely on %utilization of devices. AFAIK the percentages get calculated in an unreliable way, mostly because of the fact that utilization attempts to look at one (physical) component such as a disk, where a SAN has many virtual or shared resources (such as a RAID group) making it impossible to represent a single metric for utilization. But you might want to check with your local EMC “SPEED guru” (the guys who are storage performance experts) and ask their opinion.
It’s not that if you see 70% @ 5000 IOPS that the device could not handle more than (5000/0.7=) 7100 iops. You could probably go beyond 10.000 iops and the LUN would sit steadily at 100% util and you can still throw more iops against the dev. Ingore %util π
Your question was whether it is possible to evenly distribute the workload. The answer is, this is already done partially by Powerpath itself. It will look at a LUN queue and smartly distribute the I/O’s across all available channels. The remaining reason why you would still attempt to get distribution at the higher (LUN) level is to deal with LUN I/O queuing on the host level itself. For that you need a volume manager that can stripe across multiple LUNs. IMO the best volume manager to do this is Oracle’s own ASM. In your case I would create at least a disk group for REDO logs (only) and then another one for data. For example, your DATA disk group would span emcpowerc through emcpowerg and all DATA/INDEX I/O would be nicely balanced across those five. And REDO have their own queues on emcpowera and emcpowerb so the redo writes would bypass the DATA queue for faster log sync. Even more separation can give better performance but at higher maintenance efforts and is not always worth it.
BTW, your service and wait times are very low, nothing to worry about, so unless you want to squeeze a few extra % out of the system, I would (for now) leave it as-is π
Bart,
This is a great! Helped me a lot to understand the various aspects of performance. One thing I would like to ask you is what are the factors that affect write response time of a meta on a VMAX? Currently I am facing a situation wherein SPA shows the write response time for a meta (data files) in the 20-40ms range for write IO of about 200-300 IOs/sec. However, the WRT for another meta (log files) is less than 5ms for the same amount of write IO. The avg write size on both the metas is comparable. This is for a SQL database instance. Appreciate your response. Thanks
Hi Ron,
All kinds of stuff could be happening. How many disks make up the meta you’re writing to? And are you doing real random writes? If so, a lack of spindles or competing workloads can choke the drives, causing write cache to fill up (write pending) and eventually resulting in high write response times. Did you look at my latest post on redo log performance? You might find some answers there. Or drop me another note if you’re still stuck π
i am having similar problem mentioned on article. I see 7-8ms response time on SPA where as DBA see 70 to 300ms response time from AWR. We still face some issue on the server performance. Is there any way that I can make sure that there is no bottleneck on Storage?
If you can confirm that your 300ms response time is caused by host queueing, then you might want to create more queues, i.e. by creating more (smaller) storage volumes. Or separate out data types as I described in my recent post on redo logs.
If your service time on the Unix/Linux level (iostat svtm) is around 7-8 ms then your bottleneck is on the host. In your case your average queue size would be at least 20 (8 x 20 = 160ms, you’re likely more around 8 x 40 = 320ms). Note that multipath I/O changes this calculation a bit.
But I might add that even if the bottleneck is on the host you can still speed up the system by lowering the *storage* service time (for example, by using EFD aka Flash drives in a smart way). Quickest but probably most expensive option. I normally only recommend customers to spend dirty cash on more iron after they optimize their existing config first π
Bart,
Good post. I have a similar problem – await 188ms and svctm 4ms – on each one of my 14 LUNs striped by ASM. I guess I need more queues. Do you know a way to create more queues without increasing the number of LUNs? I could increase the number of LUNs but it’s more disruptive to my existing configuration.
Thanks for your comment!
Indeed it seems you have a lot of excess queuing on your system. One way of spreading the workload is using an I/O load balancer (I recommend EMC Powerpath but native load balancers – if well configured – can do the job as well). A load balancer distributes I/O’s across multiple physical channels. Smart ones like Powerpath even look at the size and number of I/O’s on each queue – all the way into backend storage.
That all said – you also need to make sure you don’t hit the next bottleneck. By adding more queues you open up the possibility for even more waiting I/O’s – just spread out over more channels – if a backend component (such as a physical disk) is over-utilized. But with a service time of 4ms I don’t think that’s a problem.
Another solution is lowering the 4ms – and the only way you can do this is by somehow implementing a bit of Flash storage. Such as EMC’s XtremSF cards and software.
Let me know if it helps, I’d be happy to give you more guidance if needed!
Thanks, Bart.
It seems to me that “svctm” is misleading as it’s calculated by Linux as 1/IOPS. Calculated this way “svctm” does not reflect the average response time from storage. The average response time should be calculated as QD/IOPS where QD is the number of outstanding I/Os at the host initiator, which is different from the “avgqu-sz” maintained by Linux before I/O requests are submitted to the host initiator. I am not sure what “await” reflects as it’s calculated by Linux as total wait time / total # of IOs. On my system for one of the 14 LUNs await is 168ms, svctm is 5.4ms, IOPS is 181, avgqu-sz is 36, and average response time seen by application is 90ms.
Would appreciate your comments.
In reply to your last comment (7 nov 2013):
http://www.xaprb.com/blog/2010/01/09/how-linux-iostat-computes-its-results/ explains how iostat calculates things like %util and svctm. According to that article svctm is not exactly 1/iops but utilization divided by throughput. That makes sense: if you maximize the iops then utilization = 1 (100%) and 1/iops = svctm. But only at util=100%. Reading that article I realized that the Linux kernel is not measuring the service time for each IO but instead derives it from other statistics. Thanks for leading me to that insight π
If svctm was 1/iops then consider doing exactly one I/O per second. svctm would then be 1000ms (1 s) which I don’t think is what iostat will report.
But I agree that svctm may not be really accurate. I’m also not sure how load-balancing affects these statistics. It might be still accurate or off by 50% when balancing over 2 channels.
Hope this helps.
Regards,
Bart
Good day Bart Sjerps
If I want to know about IOPS in some server is now runing.
How to calculate for Average IOPS in 1 day ? or more than that
Thank you
Hmmm… a day has 86400 seconds… did you try something like:
nohup iostat -xk 86400 > logfile &
(wait for at least a day to get decent output)
Or try “sar” which will automatically keep performance statistics for you.
http://linux.die.net/man/1/sar
Good luck
Bart
Thank you for your suggestion.
about example on top page I’m have a question if we use #iostat -xk show result.
This result is show iops on this time only ?
Thank you
Yes – iostat is a tool meant to get direct, ad-hoc performance info. The SAR toolset collects statistics for a period of time.
For example, check http://linux.die.net/man/8/sa1 to figure out how to do that.
Thank you Bart.
Now I’m keep log by your suggestion .
Can you help me easy to analysis log data for IOPS result ?
Because I have many logfile in 1 day – -”
I’m can’t make log file calculate to report IOPS.
Please suggestion easy process caculate log file to report IOPS.
I’m sorry I disturbed – – ”
—————————————————————————————
My process is
1. I’m make script iostat 1 file.
2. I’m use crontab for keep log every 5 sec.
3. Log keep on /var/log/test
but !!! I’m confused about how to calculate average IOPS for all log data.
Example my log file :
avg-cpu: %user %nice %system %iowait %steal %idle
0.04 0.00 0.03 0.04 0.00 99.89
Device: rrqm/s wrqm/s r/s w/s rkB/s wkB/s avgrq-sz avgqu-sz await svctm %util
sda 0.15 4.88 0.43 0.68 33.58 22.22 100.47 0.03 22.57 3.26 0.36
avg-cpu: %user %nice %system %iowait %steal %idle
0.00 0.00 0.00 0.10 0.00 99.90
Device: rrqm/s wrqm/s r/s w/s rkB/s wkB/s avgrq-sz avgqu-sz await svctm %util
sda 0.00 1.20 0.00 0.00 0.00 0.00 0.00 0.00 0.00 0.00 0.06
avg-cpu: %user %nice %system %iowait %steal %idle
0.10 0.00 0.00 0.20 0.00 99.69
Device: rrqm/s wrqm/s r/s w/s rkB/s wkB/s avgrq-sz avgqu-sz await svctm %util
sda 0.00 0.00 0.00 0.80 0.00 8.00 20.00 0.01 12.00 6.00 0.48
avg-cpu: %user %nice %system %iowait %steal %idle
0.00 0.00 0.20 0.10 0.00 99.69
Device: rrqm/s wrqm/s r/s w/s rkB/s wkB/s avgrq-sz avgqu-sz await svctm %util
sda 0.00 6.60 0.00 2.80 0.00 37.60 26.86 0.03 11.79 3.21 0.90
avg-cpu: %user %nice %system %iowait %steal %idle
0.00 0.00 0.00 0.00 0.00 100.00
Device: rrqm/s wrqm/s r/s w/s rkB/s wkB/s avgrq-sz avgqu-sz await svctm %util
sda 0.00 0.60 0.00 3.00 0.00 14.40 9.60 0.06 20.60 2.33 0.70
avg-cpu: %user %nice %system %iowait %steal %idle
0.00 0.00 0.00 0.00 0.00 100.00
Device: rrqm/s wrqm/s r/s w/s rkB/s wkB/s avgrq-sz avgqu-sz await svctm %util
sda 0.00 0.00 0.00 0.00 0.00 0.00 0.00 0.00 0.00 0.00 0.00
Jack,
Let’s take this offline – drop me an email (you find my contact details if you click on my picture) and we’ll sort this out further.
– Bart
If you need to analyse over a longer period of time, you may find nmon for linux very useful. Nmon has also an group option -g to specify a mapping file where you can set your disk names. For analysis there are many tools (e.g. nmon analyzer, or pGraph) We use this to keep track of our oracle disks. Another tool that is of use is collectl => http://martincarstenbach.wordpress.com/2011/08/05/an-introduction-to-collectl/
Hope this helps.
How would you explain something like this.
I am reading 200GB of data at the same time. The LUN which has the test data on it apparently believes it’s hardly being used but the host i/o is enormous.
avg-cpu: %user %nice %system %iowait %steal %idle
1.62 0.00 2.87 44.01 0.00 51.50
Device: rrqm/s wrqm/s r/s w/s rkB/s wkB/s avgrq-sz avgqu-sz await svctm %util
sdaj1 0.00 0.00 0.00 0.00 0.00 0.00 0.00 0.00 0.00 0.00 0.00
avg-cpu: %user %nice %system %iowait %steal %idle
2.12 0.00 3.75 33.33 0.00 60.80
Device: rrqm/s wrqm/s r/s w/s rkB/s wkB/s avgrq-sz avgqu-sz await svctm %util
sdaj1 0.00 0.00 0.00 0.00 0.00 0.00 0.00 0.00 0.00 0.00 0.00
There is no question I am looking at the correct lun identifier
root@fl1ul105.medco.com [/root]
# pvs |grep test
/dev/sdai1 abitest lvm2 a- 250.00G 0
/dev/sdaj1 abitest lvm2 a- 250.00G 1016.00M
The test data Iβm reading resides on this location.
p08031@fl1ul105.medco.com [/abidata_test]
$ ls -alrt *test*
-rw-rw-rw- 1 p08031 abidv 26843545600 Dec 18 09:54 ab_initio_write_test_5.dat
-rw-rw-rw- 1 p08031 abidv 26843545600 Dec 18 09:54 ab_initio_write_test_2.dat
-rw-rw-rw- 1 p08031 abidv 26843545600 Dec 18 09:54 ab_initio_write_test_8.dat
-rw-rw-rw- 1 p08031 abidv 26843545600 Dec 18 09:54 ab_initio_write_test_3.dat
-rw-rw-rw- 1 p08031 abidv 26843545600 Dec 18 09:55 ab_initio_write_test_6.dat
-rw-rw-rw- 1 p08031 abidv 26843545600 Dec 18 09:55 ab_initio_write_test_1.dat
-rw-rw-rw- 1 p08031 abidv 26843545600 Dec 18 09:55 ab_initio_write_test_4.dat
-rw-rw-rw- 1 p08031 abidv 26843545600 Dec 18 09:55 ab_initio_write_test_7.dat
Hi Louis,
A bit offtopic maybe but let’s see if we can get this sorted out π
You say you read 200GB “at the same time” – that suggests you do something in parallel? What is driving your I/O? Test tool? Linux command? Database? Ab Initio ETL tool as the file names suggest?
Did you attempt to try a simple “dd if=/abidata_test/ab_initio_write_test_5.dat of=/dev/null” to see if you could read one file at a decent speed?
Is the data on a USB drive or on an expensive but fast all-FLASH array? Or something in between like EMC VMAX or VNX? What server are you using? What filesystem are you using? What create and mount options? Using I/O load balancer?
Is the system paging/thrashing/doing some other heavy I/O on other devs?
We need more info before even making an attempt to answer your question.
From your data I can’t even be sure there is a problem…
By the way I see no host I/O at all (only I/O wait) so what do you mean when you say enormous?
Regards
Bart
Hi Bart, thanks for writing me back.
My copy and paste on this chain from this morning is not accurate.
Later on, I did find the correct LUN showing accurate usage statistics.
They matched what I saw in esxtop and vshphere. So I knew i had the right one.
Yes I was running one ab initio graph(job) which was reading 8 x 25 GB files in parallel.
This application job produced more desirable i/o activity to monitor vs what I saw from iozone and dd commands.
Once I focused on the correct LUN, i determined that each LUN needed to have noop set explicitly on the LUN level vs on the host level and hoping it would implicitly apply to the LUNS.
The result was my read speeds went up to ~300 MB/s, from 90/MB/s which is what I needed.
Guest – RedHat 5.8, Host Vmware ESXi, SCSI – paravirutal.
what I found during VMAX performance with Linux PoC last summer, were two important things:
– I/O scheduler setting. Linux defaults it to that one called CFQ (Common Fair queuing) which tries to optimize I/O before placing it onto queue, thinking of volume as one laying on single spinning drive (like laptop’s HDD). It has options, though. Best one is “NOOP” (no operations) if we use disk array with cache, making its own optimizations. That added about 30% to I/O performance for me.
– Disk Multipathing in Linux, whose round-robin default setting was set to 1000 I/Os to switch paths after. Setting it to 10 made bandwidth more smooth and linear.
Hope this adds at least 2 cents.
Hi Anton,
I was aware of the IO scheduler just didn’t realize it could have such dramatic effects! Good info. I’m planning to create some sort of Oracle on EMC performance checklist and that one certainly will be one of them.
Disk multipathing – yes, and I have seen good improvements with EMC Powerpath replacing native Unix/Linux balancers. And you’re right – if you put a burst of 1000 IOs on a queue before switching, things are not optimal.
Thanks for your response!
Hello Very Interesting
I have faced similar issues here. We use HP3PAR storage. It has adaptive optimization where blocks/chunks that are rarely queried are moved from FC – Raid 1 to FC-RAID5 or SATA disks when i/os in those blocks are low. Happens a lot on weekends. We had to pin the blocks for the data to be on the FC disks.
If the storage has similar feature/adaptive optimization some chunks that are a queried could be on FC-RAID 5 or sata disks .
Moving the data (HP has a friendly storage GUI interface) it will greatly improve the performance.
That my two cents…..
hahahah
Hi Bart,
It look we have some problem with I/O, Belew is the output of IOSTAT.For particular lun of ASM DATA disk.
avg-cpu: %user %nice %system %iowait %steal %idle
3.41 0.00 1.97 26.34 0.00 68.29
Device: rrqm/s wrqm/s r/s w/s rkB/s wkB/s avgrq-sz avgqu-sz await svctm %util
sdt1 2.00 0.00 365.50 21.50 117834.00 472.00 611.40 47.36 123.29 2.59 100.05
Can you please suggest,If there could be issue in IO.For me it looks 100% busy and await with %iowait worries,
Hi Karl,
Let me ask you a question in return. Say you want to copy some gigabytes of data from one disk to another on the same system. The copy takes 10 minutes and during the copy, the target disk is 100% utilized – but you would not mind if the copy would take 30 minutes either.
Would you invest any (dirty π cash out of your own pocket in faster disks to get the copy time down to five minutes?
If you did this and copy time is now five minutes, what do you think the new disk utilization will be?
100% utilization is not always a problem. Depends on the business service levels and whether you’re meeting them or not.
In this case, the disk is reading 117MB/s at full speed and service times are below 3ms which is pretty good. The darn thing probably just can’t go any faster. If you need more performance, spread its data across more disks.
Regards
Bart
Hi,
It’s funny how what you describe is clearly what is happening to us, especially with our Oracle DB’s, such behavior isn’t visible on the +500 Sybase ASe’s DB’s we run, many of them being highly IO bound though !
One of the things that make Oracle behaves differently, from what I could guess (it is an assumption!), is that network sql connections (the ones with LOCAL=no) do not rely for caching on the SGA (shared memory) but rather manage their own cache in PGA (which is private) resulting in physical IO’s even though other request fetched the same data at the same time or a few secs before. Hope someone could confirm or infirm this!
The only difference I see is that my avgqu-sz is never higher than 1 (RHEL 5 , sysstat 10.2.1, VxVM and VxFS, noop scheduler, and queuing disabled at VxVM level, no ODM)
We could however correlate high IO wait percentages to avgrq-sz, if DB’s are issuing large IO’s (ie gt 128 kB) it starts climbing high and high.
Hi Brem,
AFAIK the network sql connections (shadow processes) can manage their own memory indeed but it depends on the SQL queries. Especially if those are doing “direct path” IO (means they’re bypassing Oracle SGA).
There are a few ways you could optimize this. First one is use local flash such as EMC XtremSF/XtremSW so data will be cached one level down from Oracle and the processes you describe would enjoy very fast response times once data is on those flash cards. The other one is to go for All-flash arrays (like XtremIO) and you would enjoy very low response times for ALL I/O. It comes at a price tag but there are additional benefits such as near-zero overhead for database copies etc. etc. Will blog about this soon in more detail.
Regards
Bart
Hi Bart,
I guess the logics behind this direct path IOs rather than SGA cache is more adapted to Exadata, as the cost to fetch data from a L2 flash cache, which is wider than RAM for SGA, is less important.
And yes Flash is definitely something we’re looking at….
Thanks
Brem
Brem,
Direct path loads have existed long before Exadata and many customers use it for various performance reasons. In Exadata, flash cache sits on different nodes (storage cells) than the database nodes, so for the database frontend it makes no difference whether you load data via PCIe from an Infiniband adapter, or via PCIe from a Flash cache card (which is not a CPU L2 cache BTW). Whether you have Exadata with Flash or EMC XtremIO or EMC XtremSF, when doing direct path loads you still would have roughly the same database CPU workload.
Regards
Bart
Hi bart,
I have similar issue in my environment. Dba are complaining about high response time.
I have oracle asm disk from san storage. It’s redhat 6 server. Wondering what can be done from OS side as diagnosis steps!
Hi Jack,
Sounds like a no-brainer maybe but key is to determine where the bottleneck is. In many cases where I was involved, my customer could not tell me. In the case of Linux and I/O problems I would at least look at how many I/Os are on the queue on average and what the service times (from SAN) are. If service times are good then the problem is not storage (at least not directly). Unfortunately there’s no silver bullet, some things are related. Example: Database performs 1000 IOPS that somehow translate in 40,000 IOPS on the SAN. SAN handles them average in 0.5 ms. Is this a SAN or host or DB problem?
Probably a combination of more than one layer. Not always easy to figure out, let alone solving it. But I hope my post and comments help you a little bit further.
Good luck,
Bart
Hi Bart,
Excellent post, very helpful.
I am in the situation where I am installing a SAS analytics cluster connecting to a GFS2 filesystem which is hosted on a 1TB LUN on a Netapp 8040 storage device. I have 63 x 15k SAS disks in an aggregate (pool) on the Netapp device where this LUN resides.
I am connecting to this LUN to the Linux hosts using iSCSI over a 10Gbe network.
The servers are running Redhat EL 6.6.
I have set various GFS2 options to tweak performance however I don’t believe GFS2 is the issue as I have also presented a ext4 filesystem directly to the host and I experience the same problem.
Problem:-
I only get 4.5Gb/s (gigabits) of throughput to the Netapp device. The Netapp device is reporting really low disk utilisation and latency however the Linux server is reporting that the utilisation of the disk (LUN) is at 100%. It seems clear to me that the bottleneck is on the Linux host however I am not sure what settings need to be tweaked in order to get 10Gb/s throughput. Any ideas?
Below is the iostat output:-
avg-cpu: %user %nice %system %iowait %steal %idle
0.06 0.00 5.13 30.95 0.00 63.86
Device: rrqm/s wrqm/s r/s w/s rsec/s wsec/s avgrq-sz avgqu-sz await svctm %util
sda 0.00 2.00 0.00 4.00 0.00 40.00 10.00 0.00 0.00 0.00 0.00
sdb 0.00 0.00 0.00 0.00 0.00 0.00 0.00 0.00 0.00 0.00 0.00
dm-0 0.00 0.00 0.00 5.00 0.00 40.00 8.00 0.00 0.00 0.00 0.00
dm-1 0.00 0.00 0.00 0.00 0.00 0.00 0.00 0.00 0.00 0.00 0.00
sdc 0.00 0.00 0.00 960.00 0.00 983040.00 1024.00 31.15 32.39 1.04 100.00
sdd 0.00 0.00 0.00 0.00 0.00 0.00 0.00 0.00 0.00 0.00 0.00
dm-2 0.00 0.00 0.00 0.00 0.00 0.00 0.00 0.00 0.00 0.00 0.00
dm-3 0.00 121920.00 0.00 960.00 0.00 983040.00 1024.00 153.29 158.72 1.04 100.00
dm-4 0.00 0.00 0.00 0.00 0.00 0.00 0.00 0.00 0.00 0.00 0.00
dm-5 0.00 0.00 0.00 122880.00 0.00 983040.00 8.00 19515.10 158.48 0.01 100.00
dm-6 0.00 0.00 0.00 0.00 0.00 0.00 0.00 0.00 0.00 0.00 0.00
Tweaks made so far:-
DLM_LKBTBL_SIZE=”16384″
DLM_RSBTBL_SIZE=”16384″
DLM_DIRTBL_SIZE=”16384″
yum install tuned
tuned-adm profile enterprise-storage
Enable Jumbo frames (9000 MTU) between storage and servers.
I thought I would give some feedback to my own post.
I resolved my issue by installing multipath on the Linux host.
I assigned another IP to the Netapp filer in the same subnet and the existing iscsi IP’s and created a new iscsi session to the filer, so I had 2 iscsi sessions to the Netapp.
I then configured multipathd.conf to use roundrobin (default) and that was all it took.
I now have 10 gigabits throughput to the Netapp filer.
Hi Stan,
Nice that you got it sorted out. Note that what linux reports as 100% utilisation does not mean the throughput is maxed out. It just means that 100% of the time the disk (or what linux thinks is a disk) is processing IO requests. In many cases you can queue up more IO and increase BW without changing that 100%.
Oh btw, also be aware that the multipath.conf parameter rr_min_io does not work anymore as of RHEL 6.2 and you need to use rr_min_io_rq. Looks like you already got that in order so just for other readers in case you find multipath not working as expected.
https://access.redhat.com/documentation/en-US/Red_Hat_Enterprise_Linux/6/html/DM_Multipath/MPIO_Overview.html#s1-ov-newfeatures-6.2-dmmultipath
Also note that iostat has a measurement interval of seconds. In one second a whole lot of things can happen. How often does multipathing switch between channels within one second? Don’t let the stats fool you π
Thanks for sharing your experiences, it might help other readers as well!
Nice article but misleading.
“Service time (storage wait) is the time it takes to actually send the I/O request to the storage and get an answer back β this is the time the storage system (EMC in this case) needs to handle the I/O.”
It is basically not true. It could be for disk without command queue and without multipath but nowadays for most cases it is not true.
Even in manual for iostat you can read:
“svctm
The average service time (in milliseconds) for I/O requests that were issued to the device. Warning! Do not trust this field any more. This field will be
removed in a future sysstat version.”
This one is calculated not measured (you can check in iostat source to see how).
To see that svctm is flawed you can try to calculate it for multipath device with few active paths which are not used 100% all the time. The same problem is with all devices that can handle io-s concurrently. The only more or less reliable metric is await.
Hi Robert,
Yes svctm is somewhat unreliable with multipathing, this was discussed in previous comments already long time ago.
But if you take a look at the source code as you suggest, i.e. the relevant lines from “common.c” from the sysstat sources:
#define S_VALUE(m,n,p) (((double) ((n) – (m))) / (p) * 100)
double tput = ((double) (sdc->nr_ios – sdp->nr_ios)) * 100 / itv;
xds->util = S_VALUE(sdp->tot_ticks, sdc->tot_ticks, itv);
xds->svctm = tput ? xds->util / tput : 0.0;
In other words:
throughput = number of IOs / interval (i.e. IOPS, intervals are measured in centiseconds)
utilization = total clock ticks with outstanding IO / interval
service time = utilization / throughput
This is perfectly fine and mathematically correct for a “single server system” (source: https://en.wikipedia.org/wiki/Performance_operational_analysis#Simple_example:_utilization_law_for_a_single_server_system)
Of course it breaks down when multipathing but then you can still look at the individual devices and get a decent number. Therefore, I’d say claiming that svctm is completely useless is a bit exaggerated.
await is measured by adding up milliseconds – which was nice for spinning disk but now that we get NVMe and fast SSD to well below ms response times it becomes unreliable as well.
However, for basic explanation of queuing vs await vs svctm in my post, iostat did the job well. If you really need to get your hands (and cache) dirty on IO performance tuning you need better and more accurate tools, of course.
Best regards
Bart