 In a previous post, I introduced CRIPS – a measurement of the processing power of a CPU (core) based on SPEC CPU Integer Rate.
The higher the CRIPS rating, the better a processor is in terms of performance per physical core. Also, the higher the number, the better the ROI for database infrastructure (in particular, license cost) and the better the single-thread performance.
The method can also be applied in server sizings – if we know how much “SPECInt” (short for “SPEC CPU 2017 Rate Integer Baseline”) a certain workload consumes, we can divide it by the CRIPS rating for a certain processor, and find the minimum number of cores we need to run the workload at least at the same performance.
One problem remains:
How do we measure the amount of SPECIntRate a workload consumes?
The typical OS tools like SAR/SYSStat, NMON, top, etc. do not give us this number, only the percentage CPU busy.
In this blogpost I will present a method to calculate actual performance using standard available OS metrics (CPU busy percentage).
Problem statement
SPECIntRate2017_Baseline is such a hard-to-read term so we will shorten it simply to SPECInt for the sake of this article.
Given the following scenario:
We have an existing host with known specifications, running Linux, and we have the SAR/Sysstat data giving us the peak CPU busy percentage.
How do we calculate how much SPECInt it is consuming during peakload?
Example scenario
- Host system: Dell PowerEdge R650
- Deployment: Bare metal
- OS: Recent version of RHEL or compatible
- BIOS profile: Max Performance
- Processor: Intel Xeon Gold 6334, 2 sockets, 8 cores per socket, 2 threads per core, 16 cores total, 32 logical CPUs/threads
- SPECIntRate_2017 Baseline: 146 (source: SPEC)
- Workload: Oracle database (or similar highly multi-threaded, multiprocessing, CPU-bound application)
- Hyperthreading: enabled
- Peak CPU Busy: 60% (over the last month, default interval 10 minutes)
Can we just say the peak SPECInt number is 60% of the baseline? Which therefore would be 60% of 146 = 87.6?
No, because CPU busy does not translate linearly into actual performance. It would be if there was no hyperthreading, no variation in clock speeds, no NUMA effects, no virtualization, power/cooling effects, etc. With this oversimplification we might shoot us in the foot as the actual performance consumption is significantly higher.
Factors affecting actual performance
(list probably incomplete)
Hyperthreading (or Multithreading on UNIX)
The most obvious one. Our given Dell system has 16 cores, 2 threads per core, so Linux shows us 32 logical CPUs (threads). If we run just one single threaded, CPU bound process on the system, it will use just one core. If we then increase the load to saturate two logical CPUs, it will use two physical cores (a smart process scheduler will use up all cores first before it starts to use hyperthreads). This goes on until we have all 16 cores saturated, at which point the OS tells us it is 50% busy. Are we now consuming 50% of its maximum performance? No, unless you consider hyperthreading to be perfect – with each core giving us double the performance if we utilize both threads, which is clearly highly overoptimistic.
After some research I found that hyperthreading gives us about 20% performance increase if the workload is highly multi-threaded, such as often the case with RDBMS databases. Opinions on this (and mileage) may vary, but this is what I am going with for now. But the percentage can be adjusted in the calculation as requested.
NUMA overhead
As with the effect of hyperthreading, NUMA causes non-linear performance. A single core utilized will not have significant NUMA overhead as no other processor is accessing memory. You could increase the load to have one socket (8 cores) completely utilized, but, as long as all the processes run on one socket, there will be hardly any NUMA overhead. Once the load goes beyond 8 cores, it starts to kick in.
Variable clock speeds
i.e., Intel Turbo Boost, AMD Core Performance Boost
No surprise that this can cause glitches in the linear CPU performance matrix as well. A processor might not be able to run all cores at peak frequency for long periods of time. But it may be able to run on a few cores at max speed, causing the low-CPU busy numbers to generate more performance than one might expect.
Power/cooling effects
Related to clock speeds, if a processor starts to run hot, it may throttle back to protect from overheating. I expect cooling issues not to be a big problem with one core fully active, but probably it will when running all cores maxed out for longer periods.
Virtualization effects
In our example we keep it (sort of) simple by considering our workload on bare metal. But in virtualized environments, the hypervisor may not give the OS all CPUs all the timeslices they request, for example due to hypervisor overhead, or more important, CPU oversubscription (all VMs have more virtual CPU than the host has physically available and multiple VMs claim all the CPU they can get).
This results in CPU steal (See CPU Steal):
In theory, on a 32 CPU machine, the total processing time available is 32 seconds per second (each CPU can use 1 second of CPU time each second). CPU steal will cause the total available CPU time to be less than that, so it looks like we are “leaking” time.
Statistical errors
If you follow politics a bit, then you should know how deceiving statistics can be (or, sometimes, are made to be).
In CPU measurements this is no different. SAR/Sysstat records CPU metrics (by default) at a 10-minute interval. Let’s say our host is 100% busy on all CPUs for 2 minutes, then completely idle for 8 minutes within a single 10-minute interval. What can we expect as average CPU utilization? SAR will tell us 20% busy (2 minutes 100% + 8 minutes 0% / 10 minutes). If performance of short-running processes is important, then keep an eye out for this.
Calculating SPECInt from CPU utilization
As explained before, the SPECIntRate benchmark covers a lot of our problems by simply giving us a maximum performance number over an extended period. Any benefits or overhead from NUMA, multithreading, etc. is already accounted for in the benchmark result.
 The problem is that it tells us only the maximum performance, not the entire CPU utilization – performance curve, and so we need a creative method to get there.
In order to simplify things, I will make a few assumptions:
- Given the Dell R650 server in the example
- Ignore the minor effects of NUMA and clock frequency
- Performance is linear from zero until all cores are fully utilized
- Performance is also linear from all cores utilized until all threads (CPUs) are utilized
- The performance increase going from all cores to all CPUs is 20% – and I call this HT boost (Hyperthreading Boost)
- I also introduce the variable “HT factor” – which is 100% + the HT boost (in this case, 120% or 1.2)
Some simple math tells us that the system is running at 83,33% of max performance when all cores (16) utilized (because 83.33% + 20% = 100%. Actually we can calculate this as 1/HT factor = 1/1.2 = 0.8333)
This means our system goes linear from 0-83.33% of max performance for CPU % busy between 0 and 50%.
The remaining 16.66% is coming from hyperthreading, which means our system goes from 83.33% to 100% between 50% and 100% CPU busy.
This gives us the following parameters
- Number of (hyper)threads = CPUs – cores = 32-16 = 16 (FYI: on UNIX this could be something like 64-8=58, so we only count the additional multithreads)
- HT factor = 1 + HT Boost = 1.2
- Core Factor = 1/HT Factor/Cores = 0.0521 (1 core utilized gives us 83.3%/16 cores = 5.21% of total performance until all cores saturated)
- Thread Factor = (1-1/HT Factor)/Threads = 0.0104 (1 thread utilized gives us 16.6%/16 threads = 1.04% of additional total performance until all threads saturated)
- Cores saturated = MIN(Total Cores, CPU Busy * Cores) = MIN(16, 60% * 16 cores) = 16
- Threads saturated = MAX(0, CPU Busy * Threads – Cores) = MAX(0, 60% * 16 threads – 16 cores) = 3.2
- Total performance factor = Cores Saturated * Core Factor + Threads Saturated * Thread Factor = 16 * 0.0521 + 3.2 * 0.0104 = 0.8669 = 86.6% of max performance
So, in a nutshell, on this system, 60% CPU utilization translated into 86.6% of our max performance being consumed. Over 25% difference and something to watch out for.
We can now convert it into SPECInt by simply multiplying with the max performance of the server (the SPECInt Baseline): 86.6% of 146 = 126.5 SPECInt.
CPU busy – Performance curve
To illustrate the behaviour, I created a chart where I placed the percentage CPU on X, and Performance consumed percentage on Y.
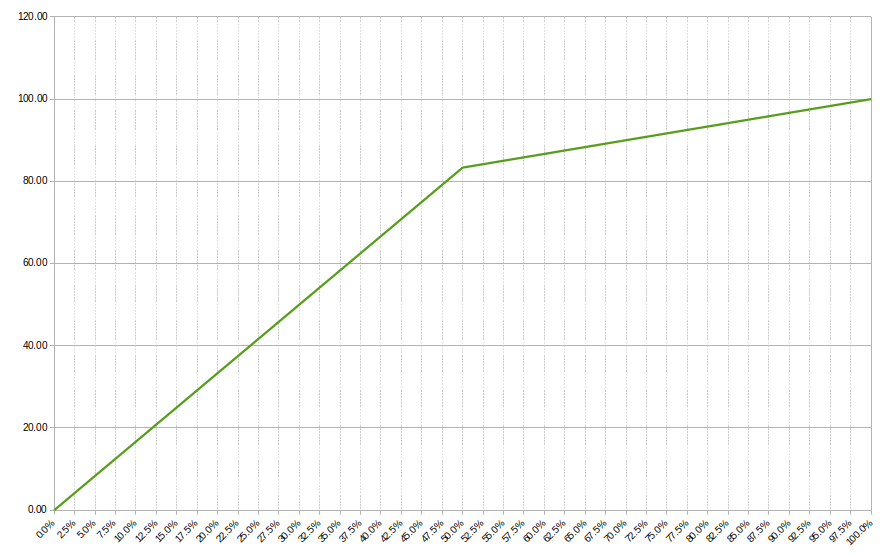
Visible is how the load increases linearly up to 50%, then breaks into a new linear line up to 100%. At 50% the factor is 83%.
I tested the model with different CPU parameters such as 8 threads/core (such as on POWER and older SPARC systems) adjusted the hyperthread boost number, etc. The formulas hold up.
That said, the real-world curve will probably not break as sharp – it remains an approximation albeit much closer to the actual numbers than simply looking at CPU busy.
Conclusion
The method and formulas presented offer a relatively simple way to calculate actual performance using only OS-provided performance metrics. We can use these numbers in further comparisons where multiple workloads, running on different CPU configurations, can be evaluated so we can accurately size new platforms to replace aging systems, without heavily oversizing due to uncertain performance levels.
Especially in environments where every CPU core is very expensive as a result of licensing policies, this can be the basis for significant cost reductions (as I have proven to many customers already, including performance validations during proof-of-concepts).
As always, stay tuned for more.
This post first appeared on Dirty Cache by Bart Sjerps. Copyright © 2011 – 2024. All rights reserved. Not to be reproduced for commercial purposes without written permission.
![]()
Comments are closed.