In my last post, I gave a highly simplified representation of “The I/O stack” of a database. In reality, it’s much more complex.
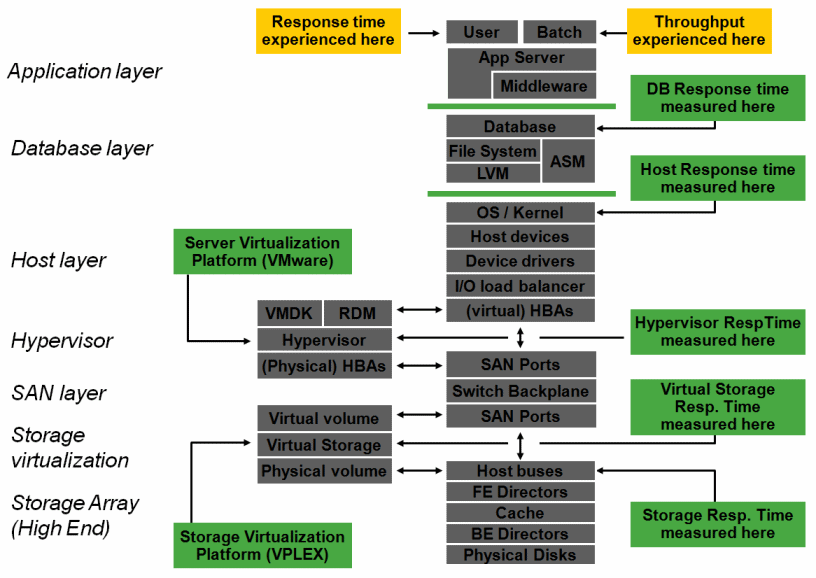
I found an old picture where the whole I/O stack of a database was described and I decided to brush it off and include some additional layers (application and middleware) and show how the I/O flows if you run on a virtual server with a hypervisor.
Also, the storage network can provide virtualization which in turn adds a layer of complexity.

I use this picture to explain our users how complex the I/O stack is and why sometimes there is miscommunication between people around these topics.
As an example, response time is typically measured in milliseconds. But sometimes people tend to forget considering at what level it is measured. I blogged on this phenomenon before here.
I will keep this article short and will go over various aspects in future posts. For now, it is sufficient to mention that in all layers you can have queuing, bottlenecks and other strange behavior.
Needless to say that even this fairly complex representation is over-simplified. For instance, it does not show the effects of storage or application replication, it does not show how some layers can process I/O in parallel and so on. But it works well as a starting point in performance discussions between various IT disciplines.
An ounce of performance is worth pounds of promises.
– Mae West
![]()

Comments are closed.